Skip To Content
Back to blog

To ensure that you’re on top of your business’s finances, you need to be aware of three financial statements: the balance sheet, income statement, and cash flow statement. Reading and updating these statements regularly is important to keep your business financially sound. 

Balance Sheet

The balance sheet is used to communicate how much a company is worth (also referred to as the company’s “book value.”) It communicates this by summing up your assets, liabilities, and equity at a specific point in time. To understand a balance sheet, you need to understand these three parts:

  1.  Assets: Typically tallied as positives (+), assets are anything owned by a company that holds inherent, quantifiable value. There are two types of assets: current (anything the company expects to convert to cash within a year) and noncurrent (any long-term investments that aren’t expected to be converted into cash within the next year).
  2. Liabilities: Typically tallied as negatives (-), liabilities are the direct opposite of assets. Any amount a company has a financial and legal obligation to pay to a debtor is considered a liability. Liabilities come in two forms: current (anything due within a year) and noncurrent (long-term obligations or debts).
  3. Shareholder’s Equity: Also referred to as owner’s equity, shareholder’s equity refers to anything that belongs to the owners of a business. To calculate equity, you add all the resources owned (assets) and subtract the claims from third parties (liabilities). There are typically two elements to equity: money, which is contributed to the business in the form of investments (often represented in shares), and earnings, which the company generates over time.

Information will most commonly be organized in a balance sheet using the formula: Assets = Liabilities + Shareholder’s Equity. If the statement is prepared correctly, these two sides of the formula should always balance.

This sample balance sheet from Accounting Coach shows the line items reported, the layout of the document and how it differs from an income statement:

Income Statement

An income statement, also called a profit & loss (P&L) statement, is the most common and critical financial statement. All your income and expenses over a given time are summarized on an income statement to show your company’s financial performance. By looking at an income statement, you can determine if a business is generating a profit or spending more than it earns. This statement is often shared as a quarterly and annual report to show financial trends over time.

Information on an income statement includes:

  • Revenue: the amount of money coming in
  • Expenses: the amount of money being spent
  • Costs of Goods Sold (COGS): the cost of all the parts it takes to produce what the business sells
  • Gross Profit: total revenue minus COGS
  • Operating Income: gross profit minus operating expenses
  • Income Before Taxes: operating income minus non-operating expenses
  • Net Income: income before taxes minus taxes
  • Earnings per share (EPS): net income divided by the total number of outstanding shares
  • Depreciation: the extent to which assets have lost value over time
  • EBITDA: earnings before interest, taxes, depreciation, and amortization

There are two commonly used methods for reading an income statement. Using both of these methods will allow you to accumulate the most insights into your business.

Method 1: Vertical Analysis

Vertical analysis is when each line item is listed as a percentage of gross sales rather than exact amounts of money. This analysis makes it easier for financial statements to be compared across periods and industries because you can see relative proportions. This method of analysis also helps with determining whether or not performance metrics are improving.

Method 2: Horizontal Analysis

Rather than looking at each line item as a percentage, horizontal analysis reviews and compares changes in the dollar amounts in a company’s financial statements over multiple reporting periods. Using horizontal analysis makes financial data consistent per the generally accepted accounting principles (GAAP), hence making it important for investors and analysts. 

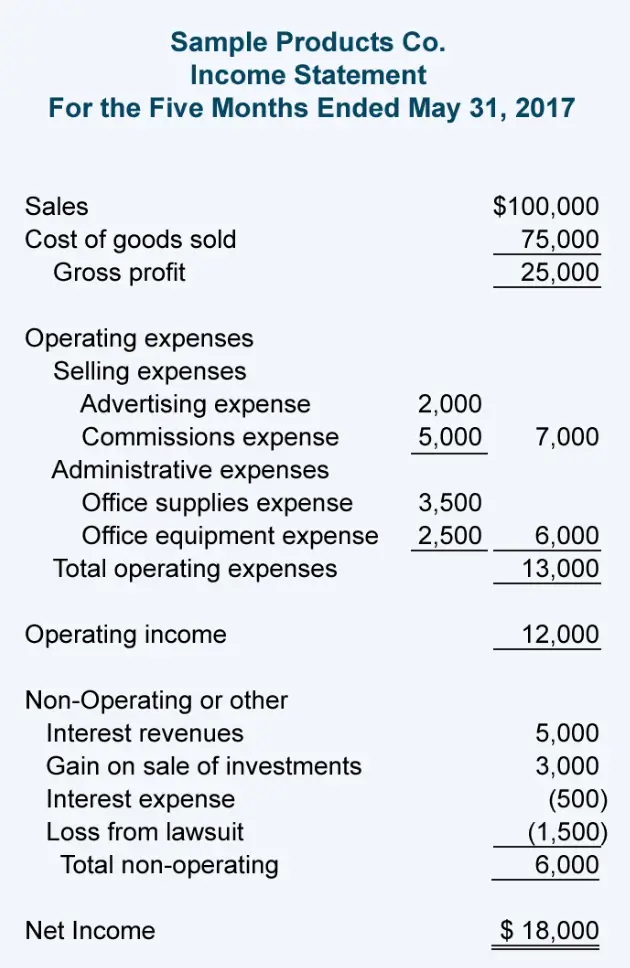
This sample Income Statement from Freshbooks shows the line items reported, the layout of the document and how it differs from an income statement:

Cash Flow Statement

The cash flow statement sums up the movement of cash going in and out of your company. The statement is typically divided into three sections:

  1. Operating Activities: cash flow that’s generated once the company delivers its regular goods/services
  2. Investing Activities: cash flow from purchasing or selling assets using free cash, not debt
  3. Financing Activities: cash flow from both debt and equity financing.

Looking at a cash flow statement, you can determine which phase a business is in, whether it’s rapidly growing, going through a transition, or declining. Cash flow is typically depicted as being positive or negative. When cash flow is positive, a company has more money flowing into it than out of it over a specific period of time. Excess cash may allow the company to reinvest, settle debt, or find new ways to grow. When cash flow is negative, there is more cash moving out of the business than coming in during a certain period. An expenditure or an income mismatch may cause negative cash flow.

Your cash flow statement must be analyzed regularly so that you can quickly recognize these kinds of fluctuations.

We don't support Internet Explorer

Please use Chrome, Safari, Firefox, or Edge to view this site.